Google Optimize
Testing alternative versions of the same content is a key stage in product improvement, and Google Optimize is the right tool for Planet 4.
Among the multiple methods to test ideas and assumptions, the most effective quantitative method is A/B testing (also referred to as split testing), usually defined as “an experiment where two or more variants of the same page are shown to a distinct segment of users, while statistical analysis is used to determine which variation performs better and drive more conversions”
While being fairly easy to implement, this methodology plays a key role to improve P4 user experience, to achieve higher and deeper engagement, the ultimate goals of a platform whose vision is drive people to action.
Product improvement workflow
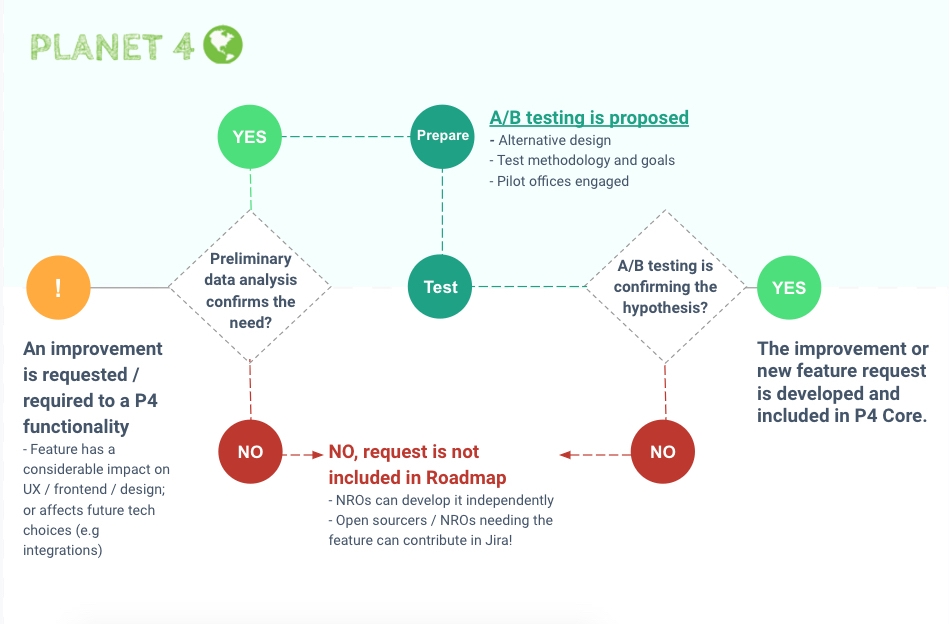
To make sure A/B testing becomes part of the continuous improvement daily practice and doesn’t just remain related to individual stories, the Planet 4 team decided to embed testing right into the feature request/improvement workflow:
Google Optimize
Google Optimise is a very cool tool that allows you to test alternative versions of your P4 content, and it’s an add on to the P4 Analytics suite.
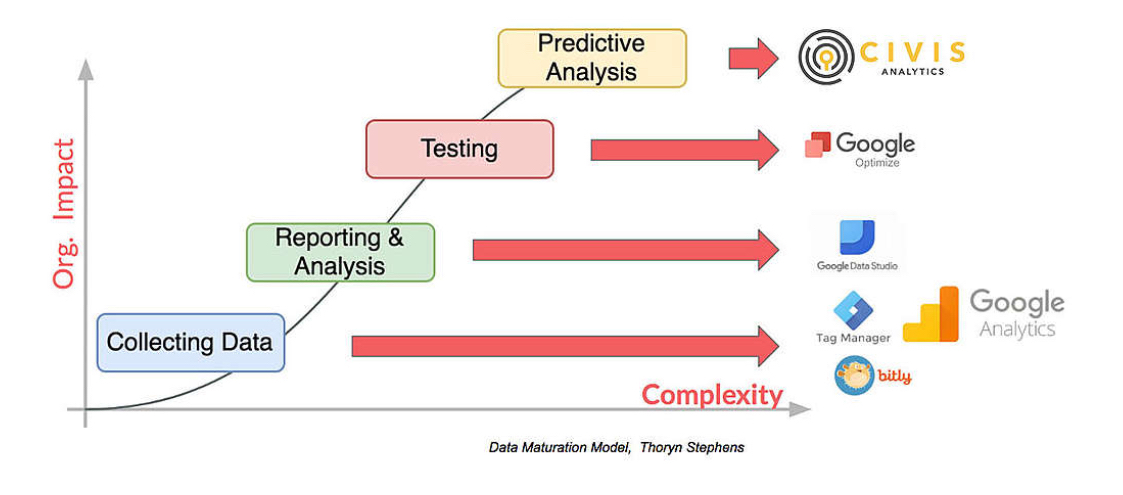
Testing and Optimization is a key stage in the Insights Framework:
Google Optimize can be easily implemented via custom events triggered in Google tag Manager and should be set up for each Planet 4 site.
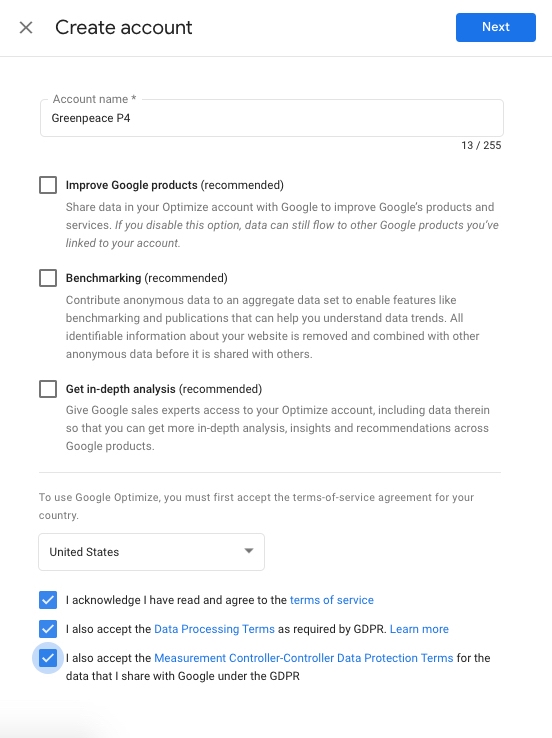
Create your account in Optimize
1) Go to Google Optimize and create your account. Don’t forget to disable the options to share data with Google.
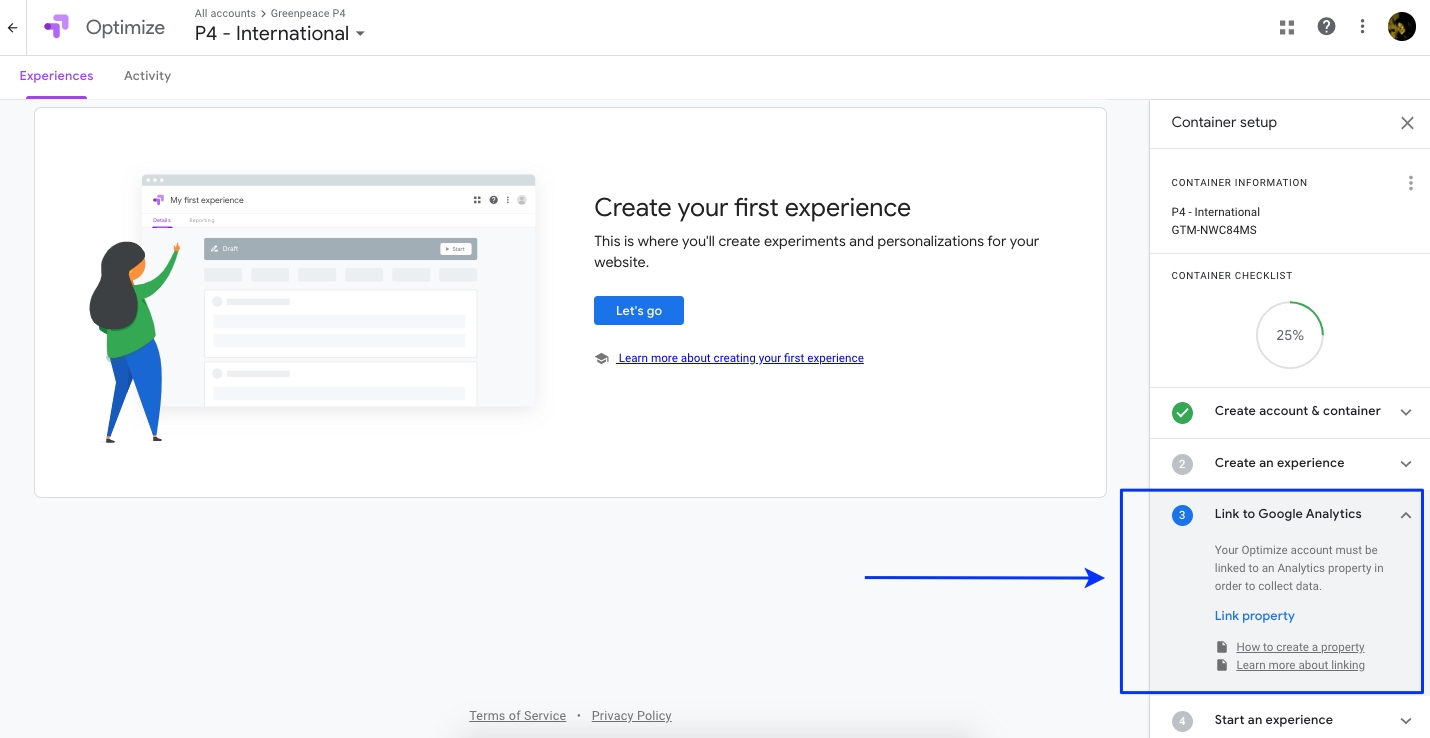
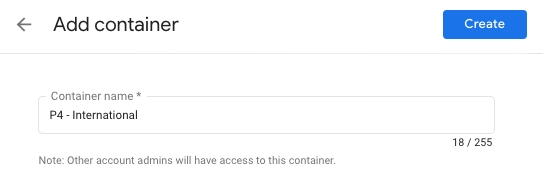
2) Add a new container under your account
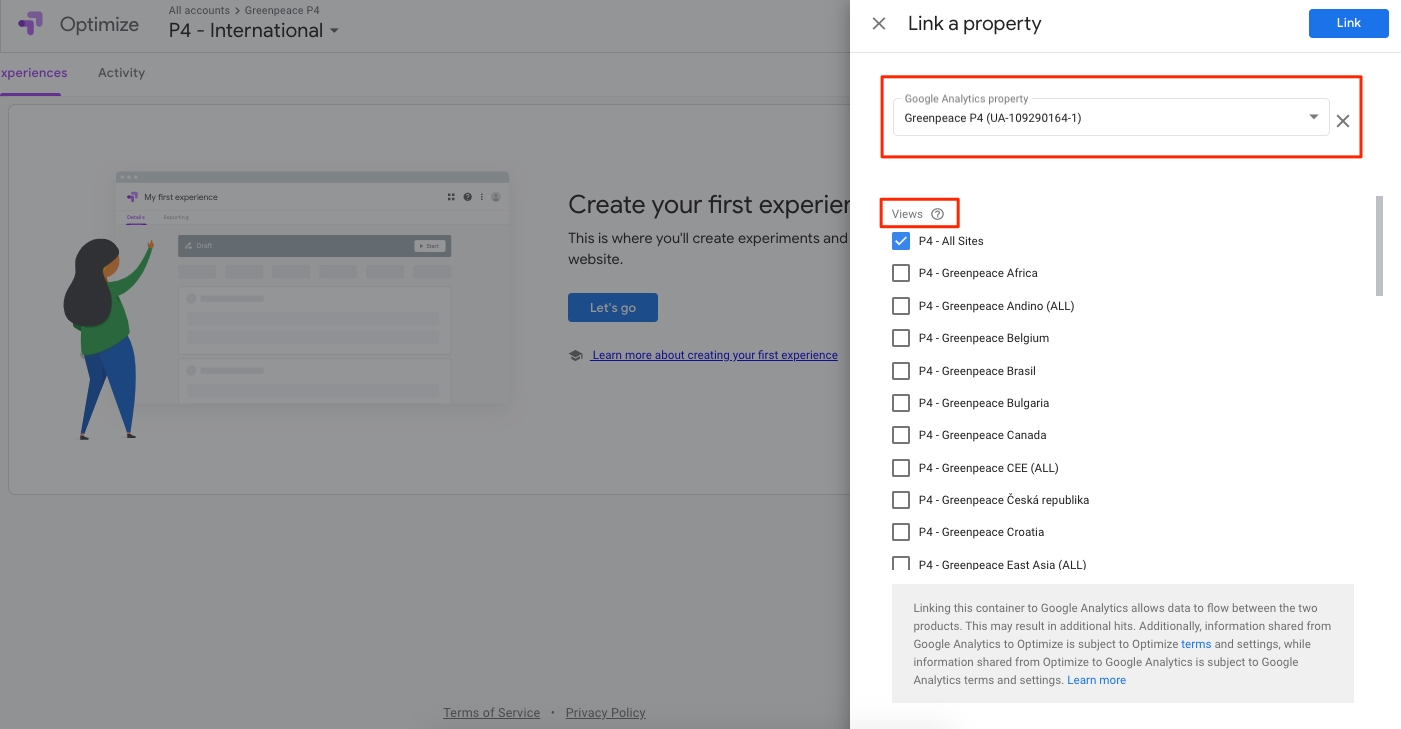
3) Link your Google Analytics property
4) Choose a Property from the list and the views you want to connect with.
5) Copy your Optimize Container ID. You’ll need to use for the set up in Google Tag Manager.
Implementation through Tag Manager
Once you have the information necessary, follow these steps to configure Optimize in Tag Manager:
1) Sign in to Tag Manager and select an account.
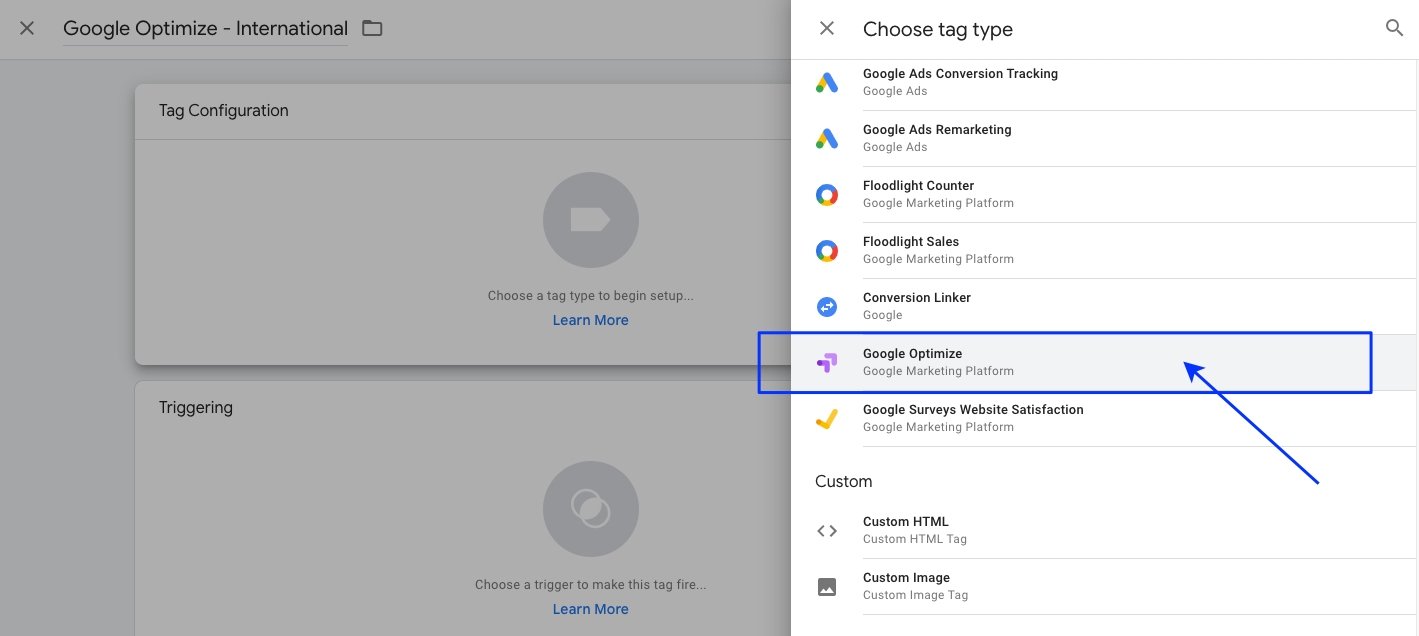
2) Click Tags > New.
3) Click Tag Configuration > Google Optimize.
4) Enter your Optimize container ID and select a Google Analytics Settings variable.
Don’t forget to select the same Google Analytics Settings variable that you have configured in your Optimize container. The Analytics Property ID should be the same.
5) Click Save and save the tag without triggers.
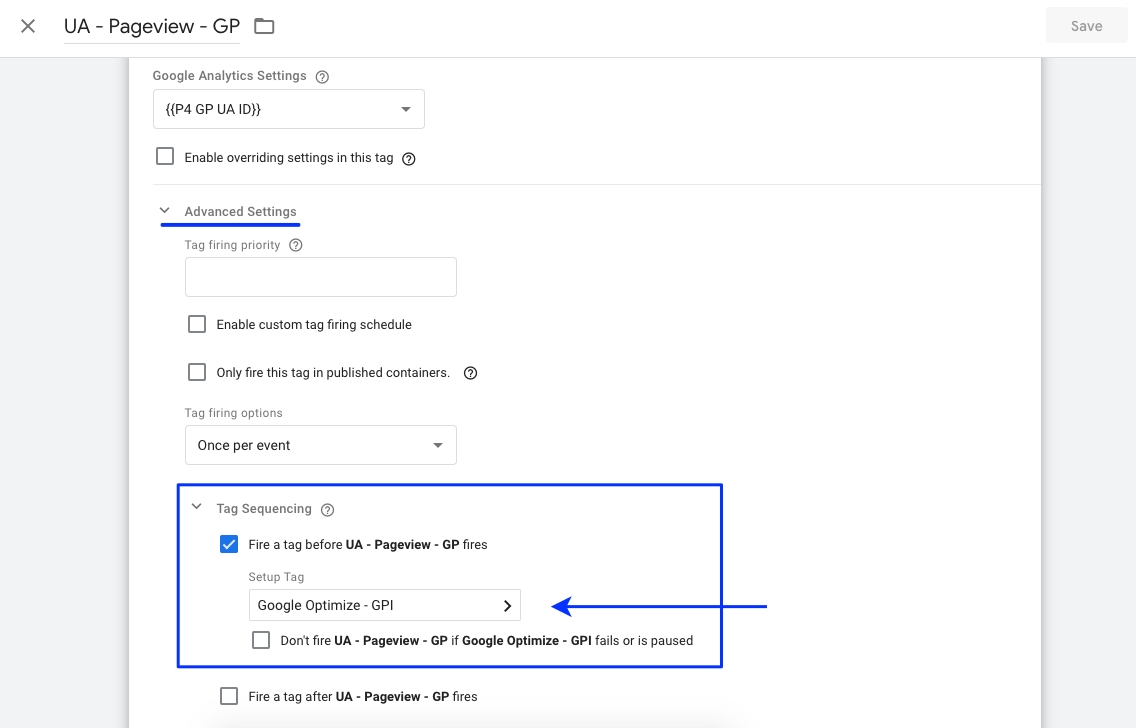
6) Open the Analytics pageview tag for the Analytics property linked to your Optimize container.
7) Click Tag Configuration > Advanced Settings > Tag Sequencing.
8) Check the box to fire a tag before this tag fires. Under the Setup Tag heading, click the menu and select the desired Optimize tag.
9) Configure the Optimize tag to fire once per page, then save it.
10) Publish your Tag Manager container for the changes to take effect.
Enable the anti-flicker snippet
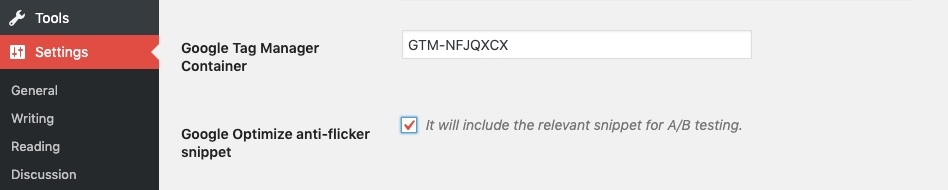
The anti-flicker snippet is a piece of code, applied on the <head> of your Planet 4 website (before GTM and after any dataLayer declarations) which temporarily hides the page while the Optimize container loads.
In some instances, when this is not applied, the user may be briefly presented with the original version before the variant is loaded, causing the restyled elements to momentarily ‘jump’ on the page. The anti-flicker snippet is able to prevent this annoying experience.
How does it work?
The snippet is referencing the same GTM ID that you are using on your website, so it will only work for Google Optimize containers that are implemented via GTM. Google’s recommendation is to give maximum priority for the Optimize tag, making sure it’s fired before the Analytics pageview tag.
More resources: How to install the anti-flicker snippet
Set up your A/B tests
Interested in this topic? Check the "Experimentation Guidebook" created by Greenpeace International to support offices and NROs in designing and running the tests.
Research
Before creating your A/B testing plan, you will need to conduct several analyses on how your website is currently performing. Tools like Google Tag Manager and Google Analytics can help you to track most of your users actions inside Planet 4. You can investigate how users are flowing through your website, which actions they are taking, pages that drive most traffic, where the users are exiting, etc. Other research methods such as surveys and usability tests can also help you to understand more about the users’ experience on the website. This can help you to identify issues on your website and define which elements and pages you improve.
Formulate your hypothesis
After analysing the behaviour data and gathering the necessary insights, you should be able to formulate your hypothesis. You can pick one or more elements of your website, make observations on them and draw solutions that could help to increase the performance of your objectives. This hypothesis will help you to direct and design your test. You can also test it against other parameters to help you decide if this should be tested or not (e.g confidence scale, the impact that this will have on your main goals, effort to set it up).
Design your test
Now you are ready to test your hypothesis. Let’s see what kind of experiments you can run with Google Optimize.
On the free version, a maximum of 5 experiments (A/B, multi-variants or redirects) can take place at the same time under the same container.
1) Choose the experiment type
There are three types of experiments that you can create: the general A/B test, the multivariate test and the redirect test.
A/B test: The A/B test consists in proposing users two (or more) alternatives of the element. The Variant A is the original and the Variant B contains the modified elements (e.g a call-to-action button with a different text).
Multivariate tests: The multivariate test consists in experiments with two or more elements and multiple modifications. This allows to test different combinations and verify which one has the best outcome. This type of test also allows you to analyse the interactions between the elements you are testing, they are useful for optimize multiple aspects of a page (e.g testing content and design at the same time)
Redirect test: The redirect test (also known as split URL test) is similar to the general A/B test, but instead of running two variants of the same page/element, the traffic will be split into different pages. The variants in the redirect test are defined by URL or page path. These tests are useful to test different user journeys or a complete redesign of a page.
2) Create your variations
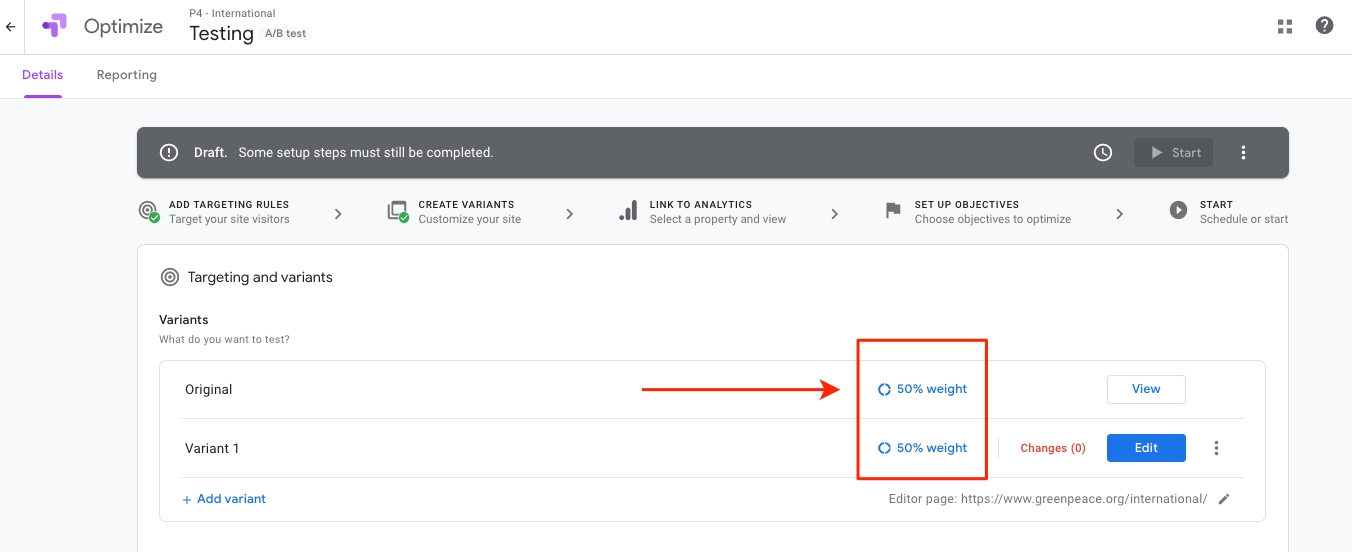
The next step should be creating the variations (based on your hypothesis) that you want to test against the original version. Each experiment page in Google Optimize includes the variants card right on the top. There you’ll be able to define the modifications that you would like to test.
A/B Tests and Multivariate Tests → You can use the visual editor directly inside Optimize. The visual editor is an overlay on top of your editor page consisting of two components: the app bar (at the top of the page) and the editor panel (floating in the lower right). This tool allows you to make changes on the content (e.g titles, call-to-actions, etc) and on the design (e.g color, height, visibility, etc) without any css knowledge, but it also allows you to change the code directly via css or javascript.
Redirect Tests → Add a new variant and define the destination (URL, path) for the split test.
Each one of the variants created is served similar times by default (50/50) to make sure that the performance can be observed and measured without the influence of external factors. But, there’s also an option to define the weight of each variant.
3) Define the target and audience
Google Optimize also allows you to define rules for page targeting and audience:
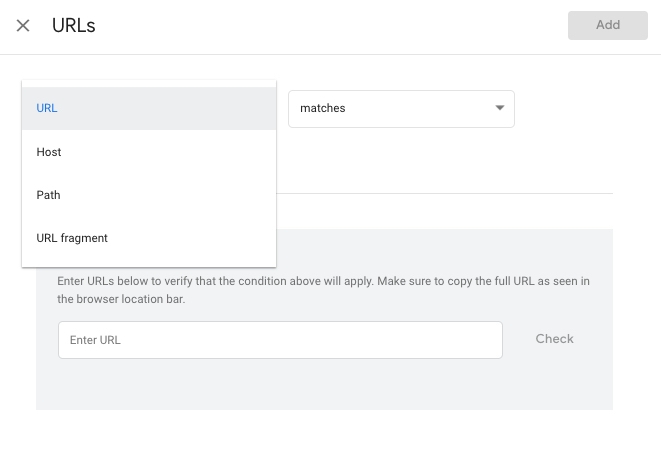
Page targeting → You can define if your experiment will run in a single page or in a specific group of pages (e.g only on blog posts). This can be done with a set of dimensions and matching selectors:
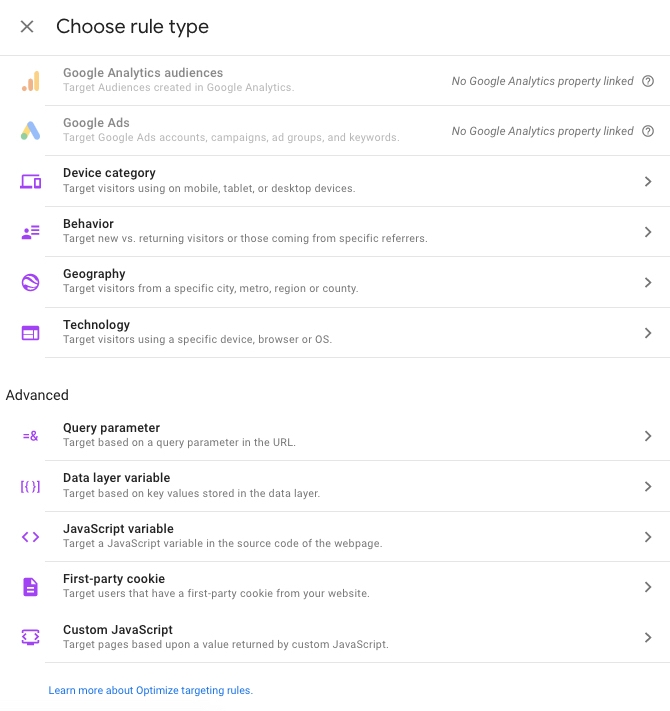
Audience targeting → You can define the audience targeting with a set of different rules. The default rules includes device category (desktop, mobile, etc), behaviour (new or returning visitors, referrer), geography (locations such as city, region or country) and technology (device, browser and operating system). The advanced rules allow you to verify cookies, dataLayer or javascript variables or even to run a custom javascript to validate certain values.
4) Define your goals
To make a successful experiment you’ll need to define a primary metric to focus on (before running the test!).
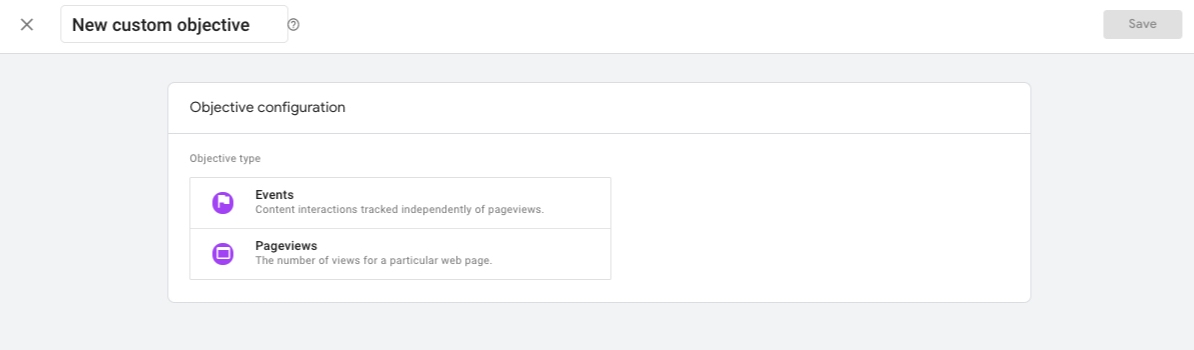
The first step is to select a Google Analytics view for the experiment. After that, you’ll be able to select the primary and secondary objectives. You can select one of the default metrics available in Optimize- bounces, pageviews, revenue, session duration and transactions -, the goals you have set up in your Google Analytics view or create custom objective (based on specific events or pageviews)
5) Final configuration
The settings tab will allow you to debug the experiment and check if Google Optimize is loading correctly. You can also define the traffic allocation (percentage of users that will be impacted by the experiment) and the activation event of the experiment (when it will be triggered).
And don’t forget to add a description to your experiment to help you and others to understand what it is about. The descriptions can include a brief of your objective and your hypothesis.
Start your test!
After testing the experiment in different browsers and devices, you can finally press start! When the status of the field says “running” this means that your experiment is live on the web!
How long should your experiment run?
Google’s recommendation says that you can keep an eye for these two conditions and end the test after they are met:
Two weeks have passed, to account for cyclical variations in web traffic during the week.
At least one variant has a 95 percent probability to beat baseline.
Analyse the results
Analysis with Google Analytics segments
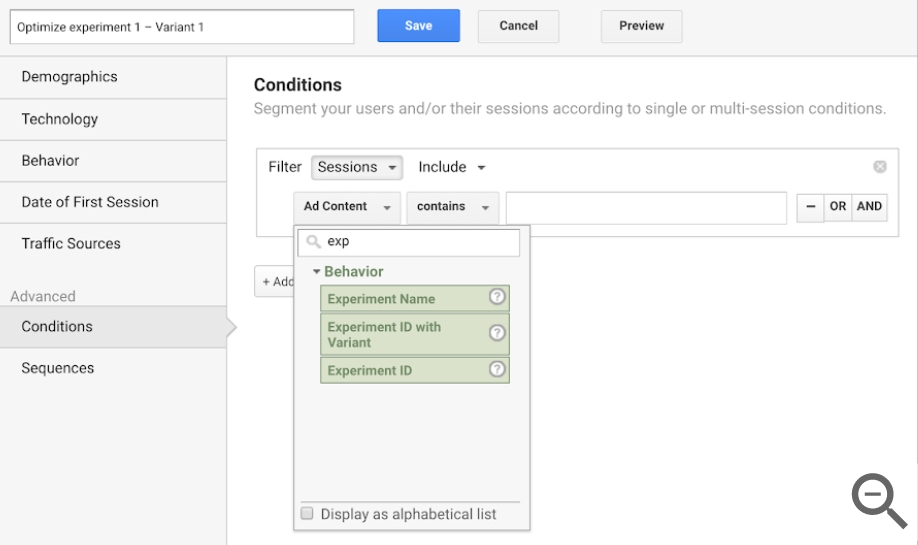
There are a few dimensions in Analytics which are connected to your Google Optimize experiments:
Experiment Name – User-generated name entered during experiment creation. e.g. “My Optimize Experiment”.
Experiment ID – A unique ID available in the information panel on the Optimize experiment details page. E.g. IzxbYxEfTeuq3bQqIAHB9g
Experiment ID with Variant – The Experiment ID with the Variant ID appended to it. Available in the information panel on the Optimize experiment details page. e.g. IzxbYxEfTeuq3bQqIAHB9g:1
These dimensions can be used as secondary dimensions in most Analytics reports and in custom segments, which allows us to further explore the behaviour of the users who were impacted by our experiments, or those users who were impacted in a specific variant of the experiment.
Experiment dimensions are session-scoped. However – unlike most session-scoped dimensions – if a user is included in multiple experiments in the same session, the experiment dimensions will have multiple values that don’t overwrite the others. The experiment dimension values will be set on all experiment sessions.
Create your segment:
1) Sign in to Google Analytics and navigate to your view and reports
2) Click + Add Segment.
3) Click + NEW SEGMENT.
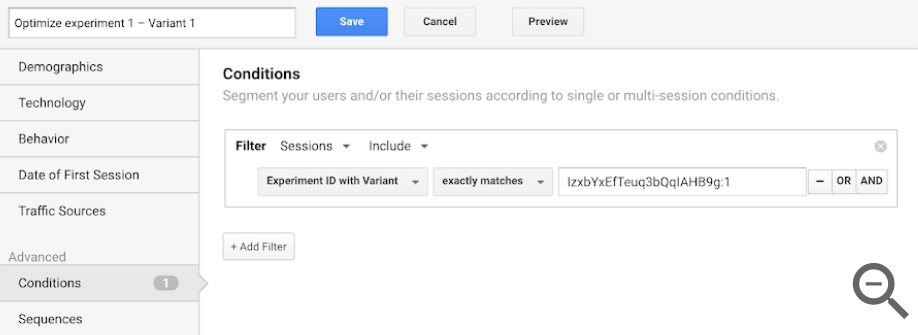
4) Click Advanced > Conditions.
5) Select filter by sessions and include.
Obs: As with all Analytics segments, if you include Users instead of Sessions, all sessions for the user in the date range will be returned as long as one session was part of the desired experiment. |
6) Select the Experiment dimension that you would like to use.
7) Select a match type and enter the value you would like to verify.
8) Click Save.
Using what you learned above you can also create a segment that includes multiple experiments or variants by using the “OR” operator and adding another filter to your condition.
More resources
Click here to use a segment template
Learn more about how to build new segments in Google Analytics.
Sampling in Google Analytics – While the data you see in Optimize isn’t sampled, you might see sampled data in Google Analytics. Optimize experiments populate in the Analytics Experiments section of the linked Analytics View, and this report may be sampled at the levels indicated by your Analytics contract. Sampling is more common if you include Today’s date or overlay a segment on the report. |
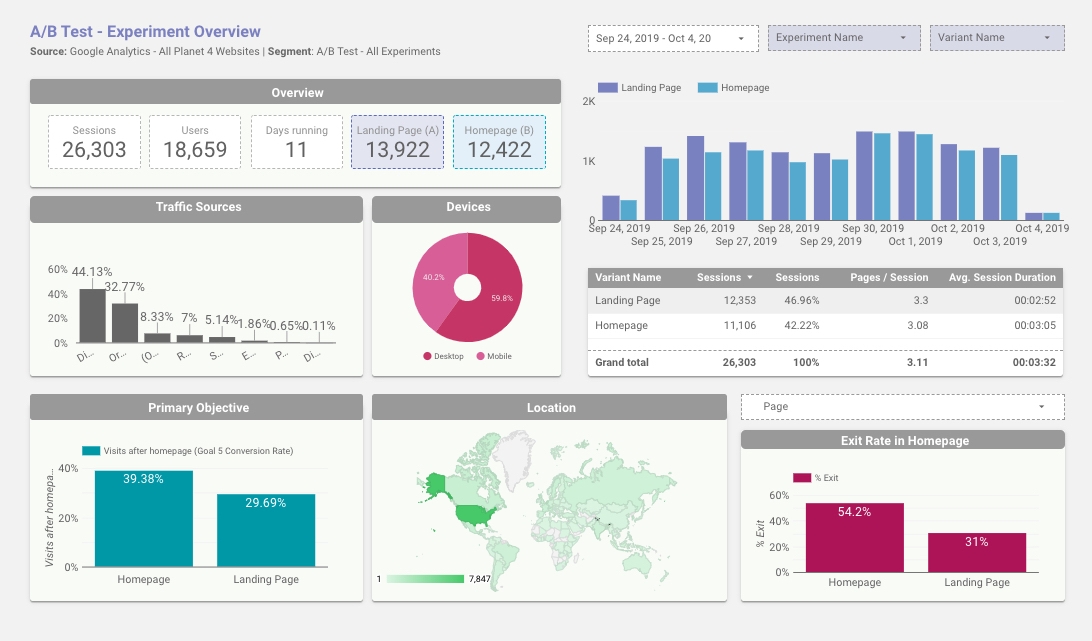
Create a dashboard
An interesting way to visualize your results and share with others is through Google Data Studio. You can connect your Google Analytics account and use the same custom segments to filter only the experiment sessions.
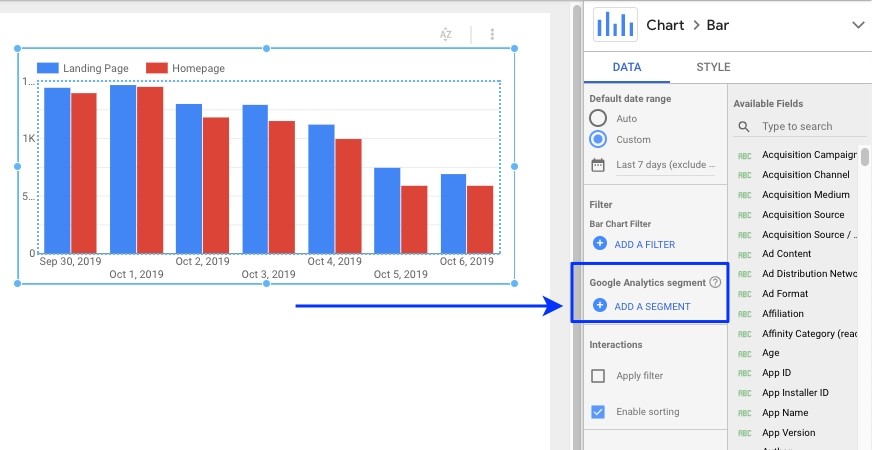
How to add a segment to your dashboard?
When creating or editing a new element (chart, table, etc) you can select the segment that you want to apply. Go to Google Analytics Segments > Add a Segment. You’ll find a list with all segments available at your Google Analytics account. Select one and this will be applied to your element.
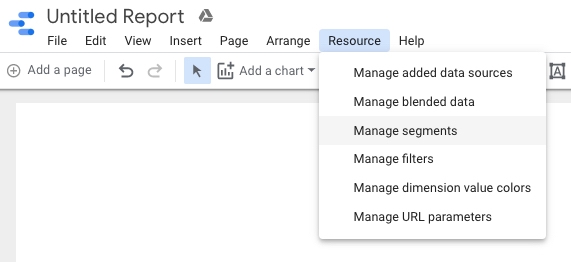
You can also edit, sync, or disable the segments that you have added to your reports in Resource > Manage Segment.
More resources
Learn more about segments in Google Data Studio
Want some inspiration? Check the Landing Page A/B Test Dashboard
Extra resources
Read our posts on Medium:
Learn more on YouTube:
Check Google's guides:
Last updated


