Google Data Studio
Easily build reports and visualize your Planet 4 stats in a clear way!
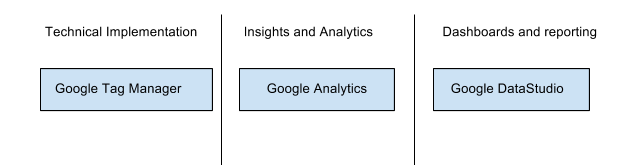
If Google Tag Manager (GTM) is where the P4 “web Stack” is setup and Google Analytics (GA) where data are consolidated, Google Data Studio (GDS) is where data are visualized, in a simple and funky way.
How many times did you, as a web editor, found yourself taking snapshots for presentations to your content owners or senior management?
Google Data Studio (GDS) provides dashboards and reports that are easy to read, easy to share, and fully customizable. Simple data in simple Dashboards allow you (or your management) to take data-driven decisions without getting lost in Google Analytics (GA), which is rightfully only used as a data source or for deep insights analysis.
Besides getting more features and ease-of-use, the key reason behind setting up this Data Studio Dashboard is to improve productivity by spending less time on reporting and more time on analysing.
How does it works?
Data Studio pulls out data from data sources (check the available connections) and produces graphs and reports, consumable by everyone who has a link or sees a page with an embedded report.
Have a look at this Video for more details on how practically GDS works:
Pretty simple, uh? Time to access Data Studio and create your Dashboard (make sure you are logged in with your Greenpeace Google ID)
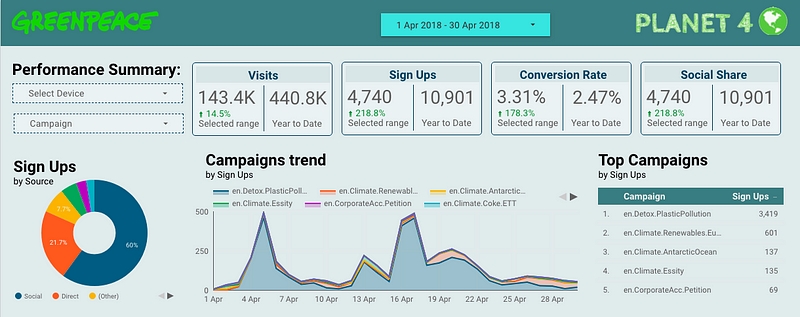
The Planet 4 Dashboard
Once your Google Tag Manager and Google Analytics are set up correctly, the idea is that with one link everyone who puts content on Planet 4, manages the site, or runs reports will be able to visualize performance data at any time, both for an overview or to take instant decisions.
This dashboard template consolidates KPIs in three pages:
Conversion (page 1)
Acquisition (page 2)
Behaviour (page 3)
When to use Data Studio?
Remember, a dashboard is not an analysis tool. A dashboard is designed with the purpose of giving quick, helpful visualizations of data, but it cannot (and should not) give all of the answers.
Here are a few scenarios* on how the P4 Data Studio Dashboard can help you take data-driven decisions like pushing successful Planet 4 content, reshaping unsuccessful ones or focusing more on successful acquisition channels rather than others.
#1 — I want to know how P4 drove people to action in the first 10 days of April for the Plastic campaign.
Page 1 (Conversion). Select the date in the drop down. Select “Plastic” in “Campaign” filter on the left menu. Enjoy.
#2 — I am considering a mobile-first campaign for Instagram stories and need to know the average monthly mobile traffic from Italy.
Page 2 (Acquisition). Select the dates in the drop down (remember, P4 was launched on January 31st, 2018). Select “mobile” on device list. See the world map? Enjoy.
#3 – I want to know how the latest Amazon Reef press release was consumed and shared in the first week of its launch (April 16th).
Page 3 (Behaviour). Select the dates in the drop down. Since it’s a fairly recent content it should be among the top results in both Scroll Depth (100% if the page was viewed entirely, 75% if up to 3 / 4 and 50 % half its length) and Social Shares.
In case it’s not among the top content, select it from the “Page” drop down on top left. Enjoy.
#4 – I want to know how many times the Ocean Plastic Toolkit (Pdf) has been downloaded from the “A Million Acts of Blue” page
Page 3 (Behaviour). Select the dates in the drop down. Since it’s a fairly recent content it should be among the top results in File Download. In case it’s not, select it from the “Page” drop down on top left. Enjoy (and maybe shorten the URL of the document?).
Get the template!
Here’s what to do to get your Planet 4 Data Studio dashboard:
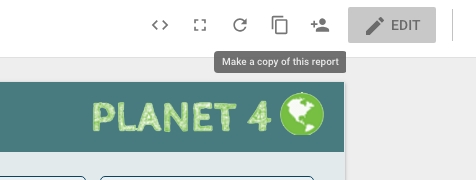
Select “Make a copy of this report” on top-right (you should be logged in with your Greenpeace Google account)
Connect the Dashboard to your Planet 4 Google Analytics view
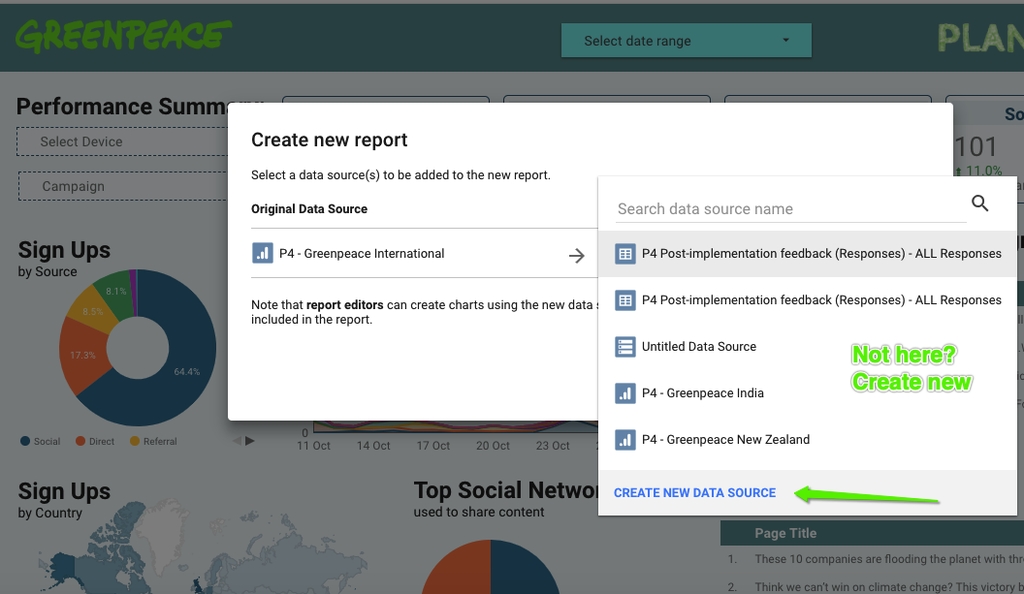
If the GA View is not available, click “Create new data source”
If your Google Analytics property is not available among the choices, just create a new one
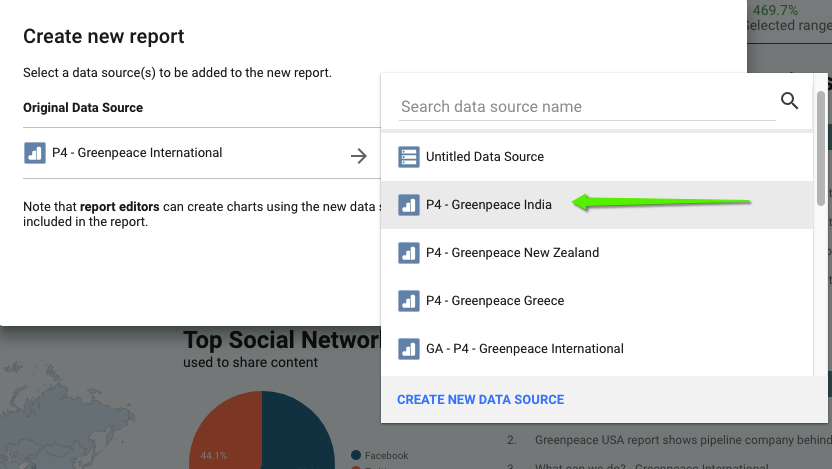
Scout for your view in the P4 Property (UA-109290164-1) and add your Google Analytics view as a data source to your DataStudio dashboard.
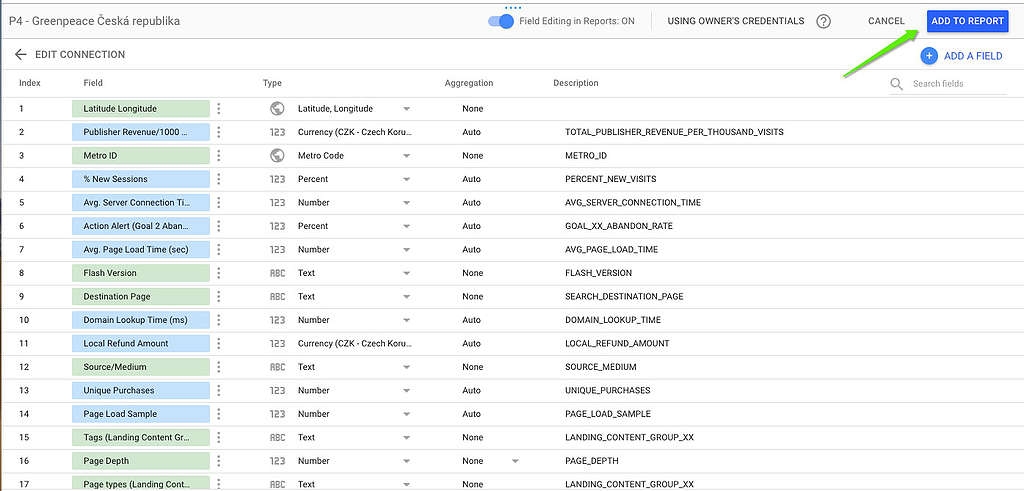
Check or edit the fields and aggregation type (the default setup is usually fine)
Click “Add to Report” top right
Now you can connect your Google Analytics data source
Click “Create Report”
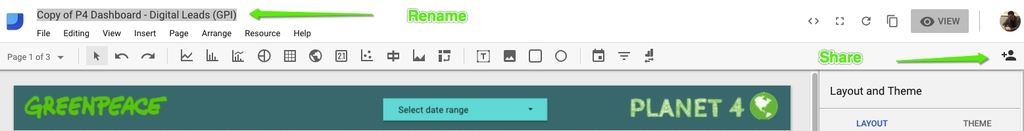
Rename your Dashboard and adjust sharing (if needed)
Adjust Dimensions and metrics to reflect your P4 Google Analytics view!
Done!
Extra Resources
Access Data Studio (make sure you are logged in with your Greenpeace Google ID)
Read more on Medium:
Watch some videos:
Inspirational Dashboards:
Antarctic global campaign – Greenpeace
Meat & Dairy Spotlight – Greenpeace
Climate Emergency – Greenpeace
Planet 4 FULL Data Studio “playing Ground” – Greenpeace – Precis Digital
Last updated